




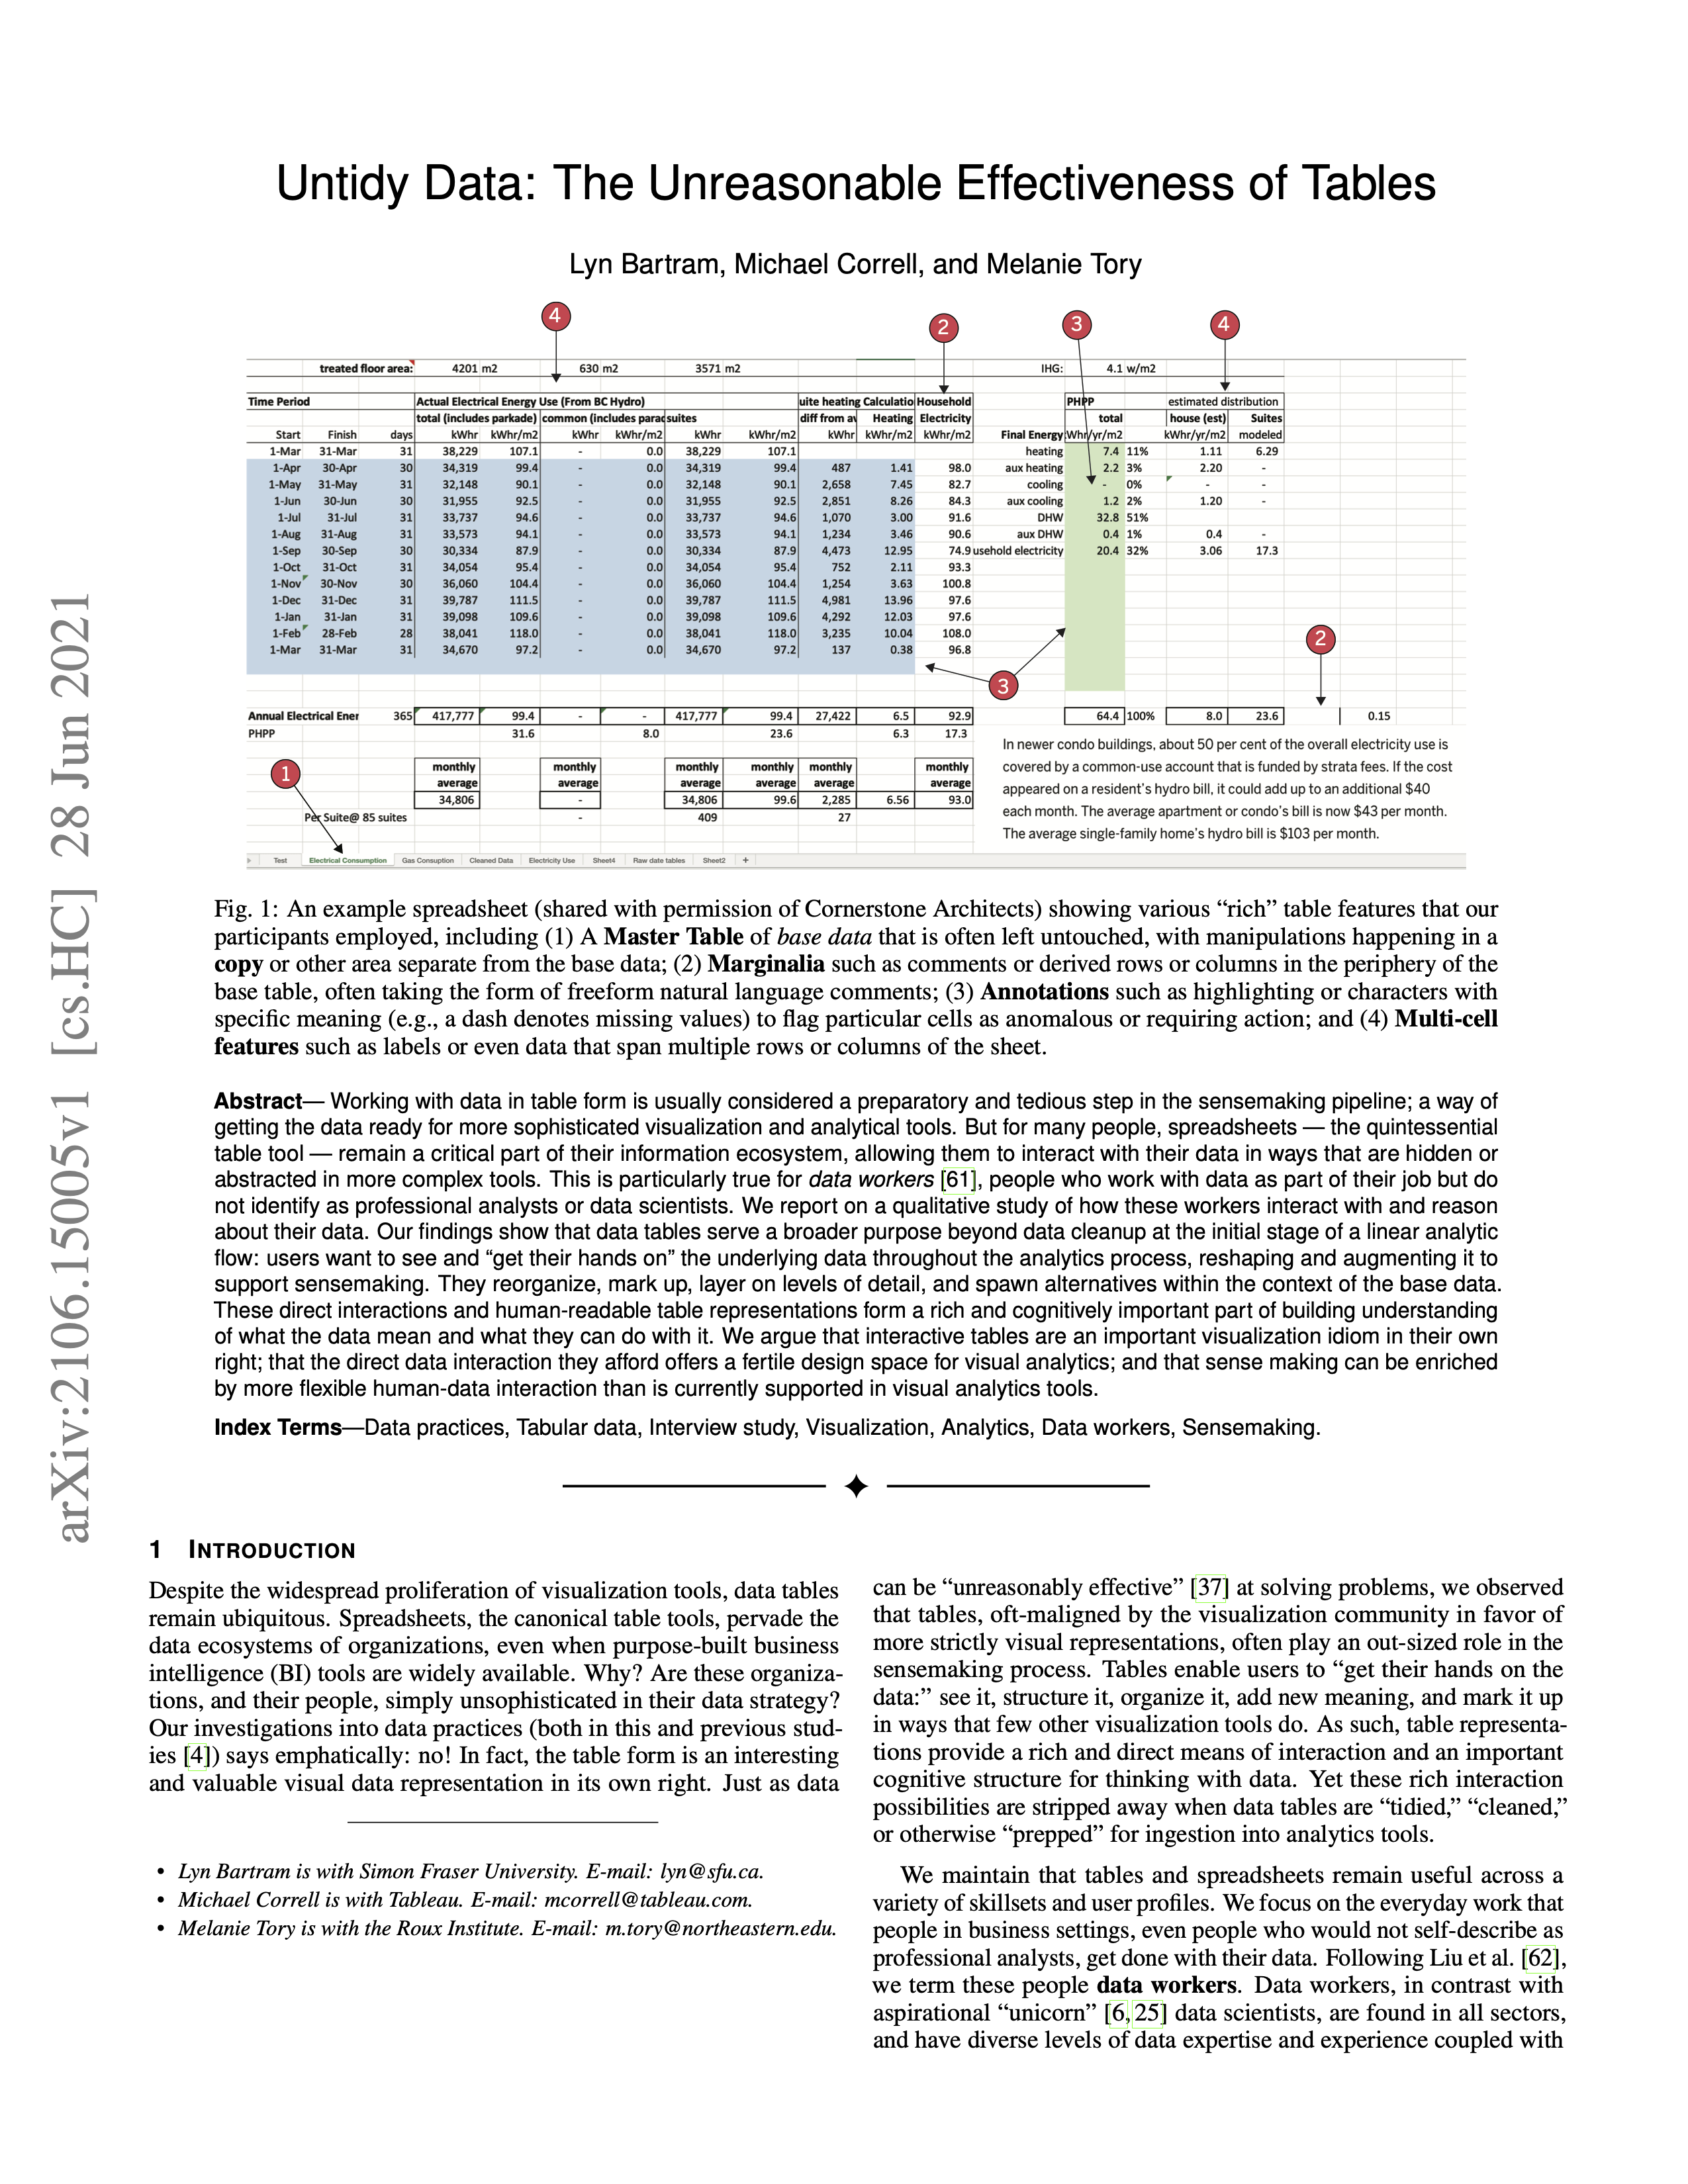
The objective of the paper is to understand how data organized by users in an “untidy” fashion and the ways they work with informally organized tables contribute to the sensemaking process.
The paper shines light on why users retain and work closely with such informal styles of organization. The authors are perspicuous enough to identify the advantages of the table idiom and informal untidy data layouts. It is a remarkable paper for the authors recognize the advantages of such practices in spite of them being perceived by many in the academic community only as a means to an end of offloading to other analytical and visualization tools.
The scientific community sees rich tables and loosely organized data only as a preparatory and tedious step in the sensemaking pipeline. It is seen as a rather primitive and transient format that is to be cleaned and made conformant to formal standards that can be processed by more sophisticated visualization and analytical tools. It is almost as if they see the features afforded by freeform organization and rich tables as a bug to be eliminated.
The authors identify two central features that the spreadsheet environment affords:
1/ Untidy data
Untidy data is the form in which data is present organically in the environments of many users who work hands-on with their data.
2/ Rich Tables
Rich tables are derived through hands-on work with the tabular format. They afford a variety of interactions for visual analytics and freeform exploration throughout the analytical process. These hands-on explorations result in idiosyncratic layouts structured for human readability and scannability. They typically do not conform to any formal tabular formats and can have extra metadata layered on top or on the adjacent marginalia.
Since such organizations are seen largely as instrumental to other important ends, it biases the community to generate only a few studies on the benefits of untidy data and idiosyncratic table structuring as first-class citizens. The authors attempt to change this by making a good case by foregrounding the salient affordances of these informal formats.
These organizations have many human-scale affordances that other analytical tools do not and enables creation of human-scale artefacts that affords experimentation, exploration, and play.
Let us see some of these properties in a bit more detail.
Freeform direct manipulation
Freeform exploration allows users to experiment and develop their understanding of the data. For many data workers, spreadsheets are a critical part of their information ecosystem that allows them to interact with their data in ways that are hidden/abstracted in more complex tools. The authors found out that untidy data and rich tables play an outsized role in the sensemaking process. They contribute towards increased agency, ownership, trust, fluency, and confidence in the userʼs work.
People want to see and get their hands on the underlying data throughout the analytics process, directly manipulating it by reshaping and augmenting it to support sensemaking. They reorganize, mark up, layer on levels of detail, and spawn alternatives within the context of the base data. Direct manipulation activities such as rearranging, associating related items, or hiding temporarily irrelevant data support fluid thinking and help one to constructively understand the work. This is backed by using Piagetʼs constructive framework on how actively constructing an artefact adds to one's understanding. Users place a high value on building trust and understanding from and via their data manipulations. Experimentation is also another sense-making activity that is especially important for verification tasks related to calculations, joins, and aggregation.
The table idiom
Rich tables are living, changing data documents with a rich variety of structures that enable different modalities of sense-making. They are an important visualization idiom in their own right that functions as a pedagogical structure, visualization tool, and directly manipulable object. It provides a cognitive structure for scanning through, understanding, presenting, and experimenting with the data.
They enable users to get their hands on data via reading, structuring, and organizing the data in idiosyncratic layouts. The layout serves as a secondary notation that conveys meaning to the user. It also enables them to add new meaning by marking up with annotations and comments that few other visualization tools do. When tables are made rich in this manner, they enhance the sense-making process by enabling multiscale readability and a precise sense of control. It also helps develop confidence and ownership in the data through these direct hands-on interactions.
Tables support efficient comparison and looking up at multiple scales. This facilitates deep understanding of multidimensional datasets. Tabular worksheets have multiple levels of detail at different “data grains” reified as different tables or sometimes within the same worksheet.
The authors remark that the table form is irreplaceable as it allows one to deal directly with base data rather than higher abstracts and summarizations which are the central point of attention in other analytical tools.
…if people can't get direct access to the base data in your analytics tool, they'll leave it and go to a tool where they can.
Consequence-free Experimentation
The authors identify a recurring pattern of users deriving data from a master spreadsheet to do certain consequence-free experimentation. Users create staging grounds for exploring, experimenting, and verifying their work in a sheet separate from the master worksheet which is kept intact. They accumulate marginalia, commentary, and other sorts of annotations in this new area to make sense of the central master table. This acts as a ground for consequence-free and transparent experimentation with data that builds confidence and trust in the data.
Marginalia
Users leverage the margins around tables to do important cognitive work. Marginalia comes in the form of additional information in the periphery of the tables like derived data, comments, colored cells, descriptions, and summaries. These are craft practices that reflect the business patterns and are designed for human readers and add context or additional details to otherwise undecorated base data.
Users might also use annotations for collaborative work. They use annotations to flag important parts of the table for follow-up, disambiguating values that would otherwise appear identical, noting down concerns about data reliability or providing structure to help navigate the visual complexity.
These spaces can also aid in the process of active sense-making when the possible categorizations haven't crystallized and there's still room for the ontology to shift. There are practices like highlighting cells as affordances for indicating various issues like blank values or as a placeholder for erroneous data that resulted from, say, a faulty merge. They are also used to indicate triaging for taking actions by a team. Explicit cells were also noticed to be leveraged by users to take notes as this helped with glanceability rather than keeping them as in-cell comments.
Such metadata and annotations that don't fit into the tidy data structure are recognized by the authors as salient information when modeling, importing, or working with data. This data is rarely standardized or amenable to actions like sorting or pivoting. Authors note that cognitive and technical benefits that get leveraged through untidy data and rich tables get lost as they are translated into the tidy format. During this process, users found it violating their mental model and losing important auxiliary sense-making data like bespoke layouts, annotations, and other marginalia.
A problem with this paper is that the number of people engaged in the study was too low to infer any kind of general patterns from the work. While helpful to elicit certain practices and characteristics in the spreadsheets that users leverage, it felt like a study without enough substantiation to generalize or identify the key dimensions of variations in usage. The authors are prudent enough to point this out and say that the data work represented in this paper is not to be generalized beyond their discussion. Nevertheless, even such limited research suggests that a lot more systematic studies are needed to unearth the unique advantages of untidy data organizations and rich table structures in the spreadsheet environment.