Spreadsheets as a Tool for Thought
Evolution of the Spreadsheet Interface
This is a series that takes a synoptical view of how spreadsheets changed the world of business. In this post, we will look at the historical evolution of the spreadsheet interface.
Why spreadsheets continue to be one of the most successful mediums for computation is a question I have been mulling over since we embarked on this project. This series is an attempt at piecing out an answer from the multiple angles we have considered.
Clay Tablets
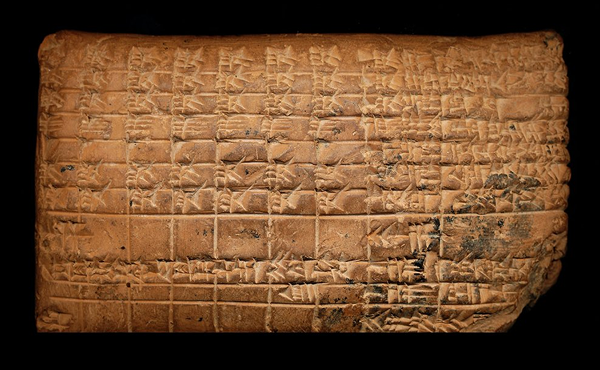
With the agricultural revolution circa 10,000 B.C., humans predominantly shifted from being hunter-gatherers to a settled society. This led to a more complex societal organization, which necessitated division of labor. The need to track and document economic transactions to manage the labour among multiple parties necessitated bookkeeping. This was done using the recording devices of the day, such as parchments, vellums, and clay tablets. Clay tablets provided a solid substrate for the records because of their durability. Excavated clay tablets are some of the earliest records we have of data in tabular format.
Inferring from these archaeological records, the idea of tabulated data goes back at least as early as the 26th century B.C. Clay tablets were baked with the accounts of citizens on the credits and debits they owed in the community. This tabulation format was so pervasive that we find evidence of it quite likely convergently evolving in remote parts of the world throughout antiquity. There are multiplication tables dating from China from 300 B.C., which use bamboo sticks to organize the data as tabular grids.
This format evolved as times progressed from ancient to medieval times across many ports of call and in different parts of the globe. They were propelled forward in bookkeeping devices in astronomy, geography, religious observances, etc. Contrary to popular belief, there was no homogenous suppression of science across all the cultures in the medieval ages, but rather the curiosity, bookkeeping, and utilitarian needs of the time promoted advancement of science and accompanying data collection. It has to be remarked here that our ancestors didn’t conceive of science in the same terms as we see it today, but rather their context and worldview were very different from ours to claim it was suppressed.
Universal History and Canon Tables of Eusebius
Some developments worth highlighting from the Middle Ages to give an idea of how the tabular format was leveraged for sense-making purposes are the work on the Chronicon, the Canon tables, and the evolution of “Computus” for calculating Easter dates. The first two of these were invented by Eusebius of Caesarea who lived around 300 A.D.
In his Chronicon, Eusebius compiled and tabulated the significant dates and events across the world. In creating this universal history table, we find his curiosity to gain a global picture of how history is unfolding across time and space expressed as a 2D table.
The idea of Canon tables is even more interesting from the vantage point of spreadsheet design. This was a device that helped identify the self-contained and repetitive passages across the four Gospels of John, Luke, Mark, and Matthew. It created cross-references for passages that were repeated across the four Gospels and thus helped with gaining a global sense of structure for students who analyzed the Gospels.
The Computus
A principal use of astronomy in the medieval period was to calculate the date of Easter, around which a significant part of Western religious life was centered. This collective need for marking the time of Easter found its fulfillment in the Computus—a collection of algorithms that calculated these dates for many years, sometimes hundreds of years, in advance.
The Eastern Romanian monk Dionysius Exiguus reconciled the differences across different systems of calculations and developed an algorithm for dating Easter. He also happened to devise the Anno Domini (B.C. / A.D.) system used in the standard Gregorian calendar adopted across the world.
This system for calculating the Easter date is called the Computus. This Latin word is the root word for “computer.” In contrast to the Galileo story that gets told about how the Church oppressed the advancement of science, there is a very real way in which the computers we use today came out of the bookkeeping and liturgical timekeeping needs of the clergy in the Middle Ages.
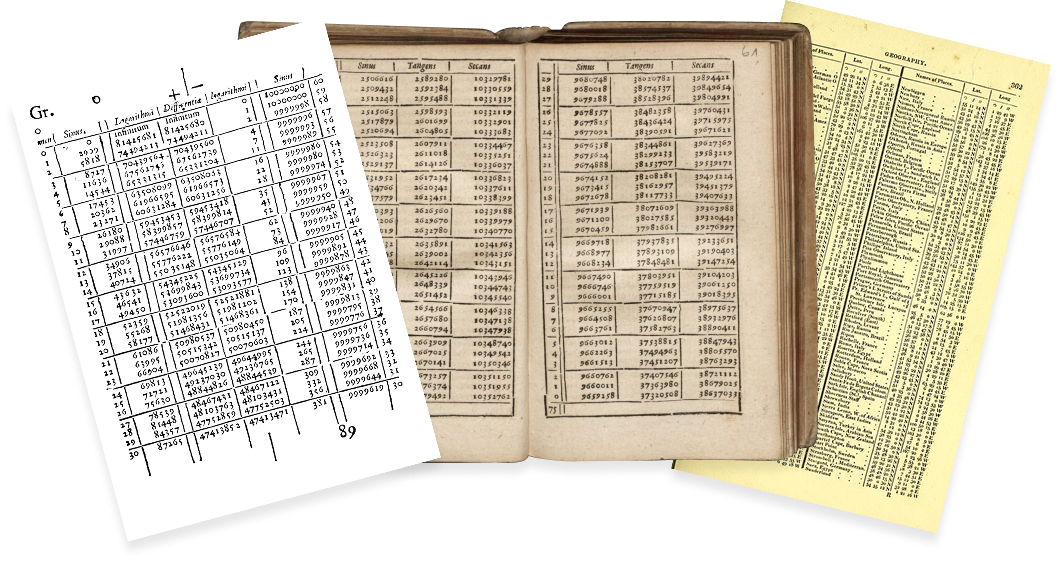
After the Middle Ages, science catapulted into prominence because of its demonstrated utility in the form of various technologies and the marvelous strides made in understanding the natural world around us. With the advancement of sciences, bookkeeping became a prominent activity, and a wide variety of data across disciplines started surfacing. Tables found pervasive presence in the form of manuals, ledgers, encyclopedias, and record books where computations were written down for lookup, communication, and further computational purposes.
With the industrial revolution and burgeoning of associated bureaucratic work around the business activities, these notational devices would then find expression in the format of ledgers, which were used pervasively in accounting. The advancements in rational endeavors to understand and operate upon the natural world resulted in an unprecedented rate of production of data in this period. Organization of this frequently found its expression in tabular formats, as they allowed for examining multiple observations simultaneously and gaining a big-picture view of the situation.
The Ledger
In a typical ledger book, calculations were recorded in tabular format. The namesake of spreads in spreadsheets was the size of two pages across a ledger in which the rows and columns of data were laid out for business professionals to make sense of the company’s financial position.
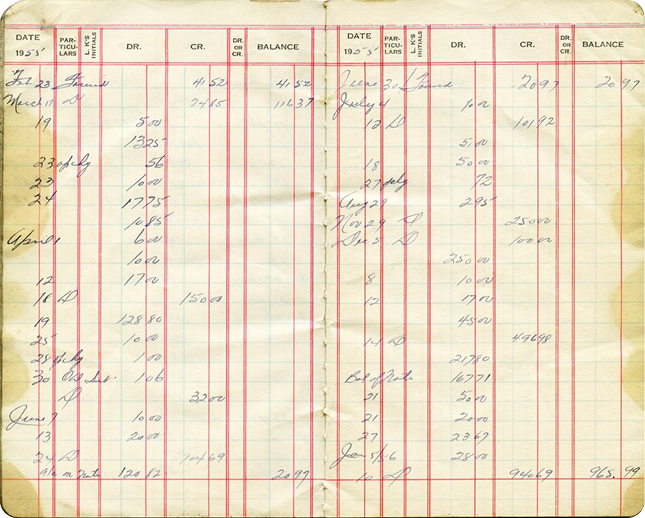
Output from several spreadsheets spread across multiple ledgers provided input for master spreadsheets. This process was laborious, and a change in one place meant propagating this change across dependent areas that used this as the input. This took many hours of rewriting the chains of computations where that data value was referenced and needed updating. Because of the tedious manual work this necessitated, it was mostly relegated to accountants, junior analysts, or secretaries. Executives would then use these calculations as inputs for their modelling tasks.
Mainframe Computers
With the advent and adoption of mainframe computers circa 1950s, financial work of this nature started being digitized. Mainframe computers operated in the batch processing paradigm: the operator would feed these computers the required inputs, often multiple records, and would wait for the computer to process these to generate the output. This, while considerably reducing the turnaround time compared to manual labor, still retained the divide between accountants or helpers who did the manual processing work and modelers who operated at a higher level using the processed data as input.
Proposal for Electronic Spreadsheets
It is around this time that the idea of computerizing spreadsheets was first proposed for the mainframe computers by Richard Mattessich. He articulated it in his work “Budgeting Models and System Simulation” (1961). According to my research, this idea was implemented as Business Computer Language (BCL) by Brian Walsh in 1961, and this might well be the very first instantiation of an electronic spreadsheet. And most of the backlinks owing to bitrot are inaccessible right now, and the only point I could locate was an archival record of the instruction manual at Marquette University, where Walsh apparently taught it.
It is interesting to note that since the publication of his original paper, Mattessich subsequently published his seminal work, “Accounting and Analytical Methods,” with a companion volume called “Simulation of the Firm through a Budget Computer Program” in 1964. In the latter work, in collaboration with Paul A. Zitau and Thomas C. Schneider, he provided the complete source code listing for the spreadsheet program in FORTRAN IV! There is a fascinating GitHub repo by Norbert Kehrer that simulates this in Javascript.
First Spreadsheet for Personal Computers
The idea of an electronic spreadsheet continued to be operationalized for mainframe computers in many places towards the 1970s in LANPAR, Autoplan/Autotab, IBM Financial Planning and Control System, etc. But the costs were prohibitive for these mainframe computer hardware and software packages to go mainstream. It took the conjunction of the arrival of personal computers and Dan Bricklin and Bob Frankston writing VisiCalc in 1979 for Apple II to make the personal computer and spreadsheet a household name.
Dan Bricklin notes in his Harvard Gazette interview:
“Computers were not something used by the average person, any more than a nuclear reactor is something that’s used by a regular person today ... Using a keyboard, even on a typewriter, wasn’t a common thing for most people in business; there were secretaries or steno pools.”
With VisiCalc, the adoption of spreadsheets in business was so pervasive that people view the history of business as before and after spreadsheets. The movement to electronic spreadsheets was such a big leap that it transformed the world of business that it brought an order of difference to the volume of trade. It wouldn’t be hyperbole to add that spreadsheets were one of the main propelling forces behind making computers a household name. Steve Jobs, in an interview with Japanese TV network NHK, quipped:
“There have been two real explosions that have propelled the industry forward. The first one really happened in 1977, and it was the spreadsheet. I remember when Dan Fylstra, who ran the company that marketed the first spreadsheet, walked into my office at Apple one day and pulled out this disk from his vest pocket and said, “I have this incredible new program—I call it a Visual Calculator,” and it became VisiCalc. And that's what really drove—propelled—the Apple II to the success it achieved.”
When spreadsheets were introduced, the first departments that adopted spreadsheets were the research, planning, and budgeting wings. Curiously, these wings were only indirectly responsible for updating financial records. Microcomputers, as they were known at that time, like the Apple II and Commodores, were leveraged to do number crunching on quarterly and annual financial reports on Wall Street. Computers changed the face of Wall Street by accelerating the volume of share days conducted in a day. It catapulted it from 5-10 million in the early 1960s to over 60-100 million by eliminating labor-intensive work by the 1980s.
Post VisiCalc, the history of spreadsheets more or less got solidified into a 2D grid with formulas to establish relationships among cells. There was little drastic change to the core design pattern. Going further, if one zooms back on the nearly 5 millennia of history skimmed over here, one will find that there has been little divergence from the 2-dimensional grid system. The very same graphical representation of a tabular pattern recording observations across variables remained consistent after close to 5000 years of development. Why this core design pattern and the interaction design around it as it moved to the interactive paradigm have been so pervasive and effective is something we will explore in the next part of this series.