


This paper attempts to uncover why spreadsheets are a successful medium for sense-making. A neat idea we learnt from it is the hierarchy of organization that describes how knowledge is generated from glyphs.
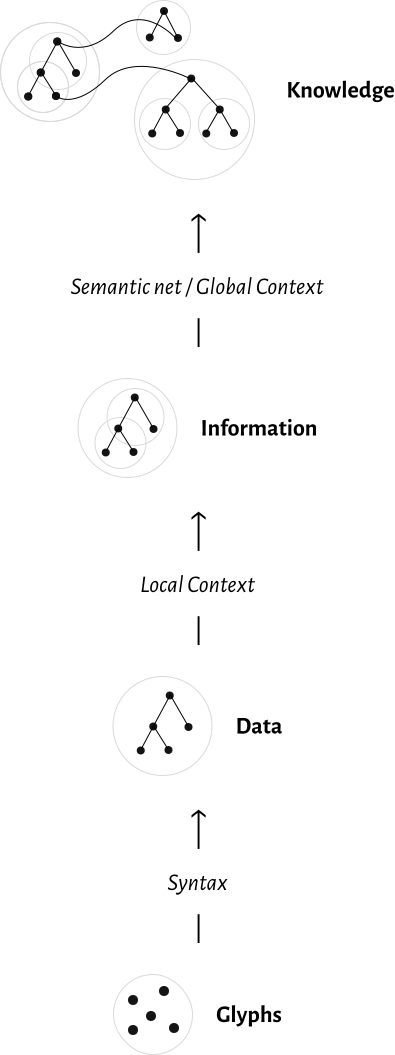
Glyphs are a set of characters. Combined with a syntax they become Data, enriched by context they become Information, and finally, they become Knowledge with the presence of a semantic net or a global context. This is a helpful schema to make sense of the progressive levels at which the spreadsheet document gets cognitively parsed by users.
The paper draws out a distinction between people who author spreadsheets and those who read spreadsheets. A study on the information models that readers of spreadsheets use to parse the spreadsheets is conducted. It establishes this using a principal component analysis and generalized Procrustes analysis.
A repertory grid study is conducted which unearths two axes with interface perception on the x-axis vs. information perception on the y-axis. These are the two ways in which users perceive a spreadsheet. Abstractions in the spreadsheet environment vary in their character depending on whether the user is considering the spreadsheet as a tool (interface perception) or with respect to its information content (information perception).
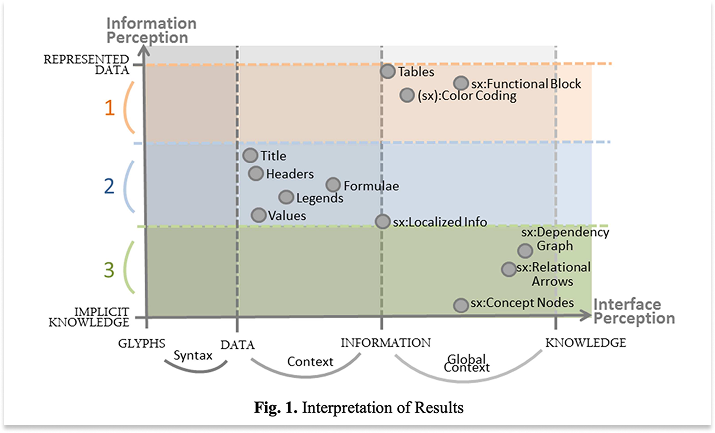
It felt a bit odd that the ideas plotted in this graph were left unexplained in the paper. Perhaps this is a paper where Kohlhase is attempting to build the appropriate terminology for her further studies and these ideas get further coverage in subsequent papers on this topic.